Edited by Pranav Udeshi
Feb 13, 2025
Your Execution Algos Are Leaving Money on the Table - Here’s Why

Are Your Execution Algorithms Keeping Up? The Hidden Cost of Legacy Routing Strategies
Many trading desks still rely on execution algorithms designed for a simple market structure—built for convenient liquidity conditions and slower-moving order flow. But in today’s fragmented, high-speed markets, these outdated strategies are quietly bleeding money. If your execution model isn’t adapting to real market conditions, how do you ensure you’re not consistently losing on price, fill quality, and execution efficiency?
Let’s consider the smart order router (SOR) algorithm. Traditional ‘naive’ SORs manage order flow across multiple venues using simple, intuitive rules. The most common approach divides orders evenly across exchanges, while slightly more sophisticated versions might adjust based on known liquidity pools or order type. Consider an example of buying 1000 AAPL stock. A typical decision we might see places all aggressive orders, but splits the purchase to NYSE/NASDAQ, 500 limit orders to each.
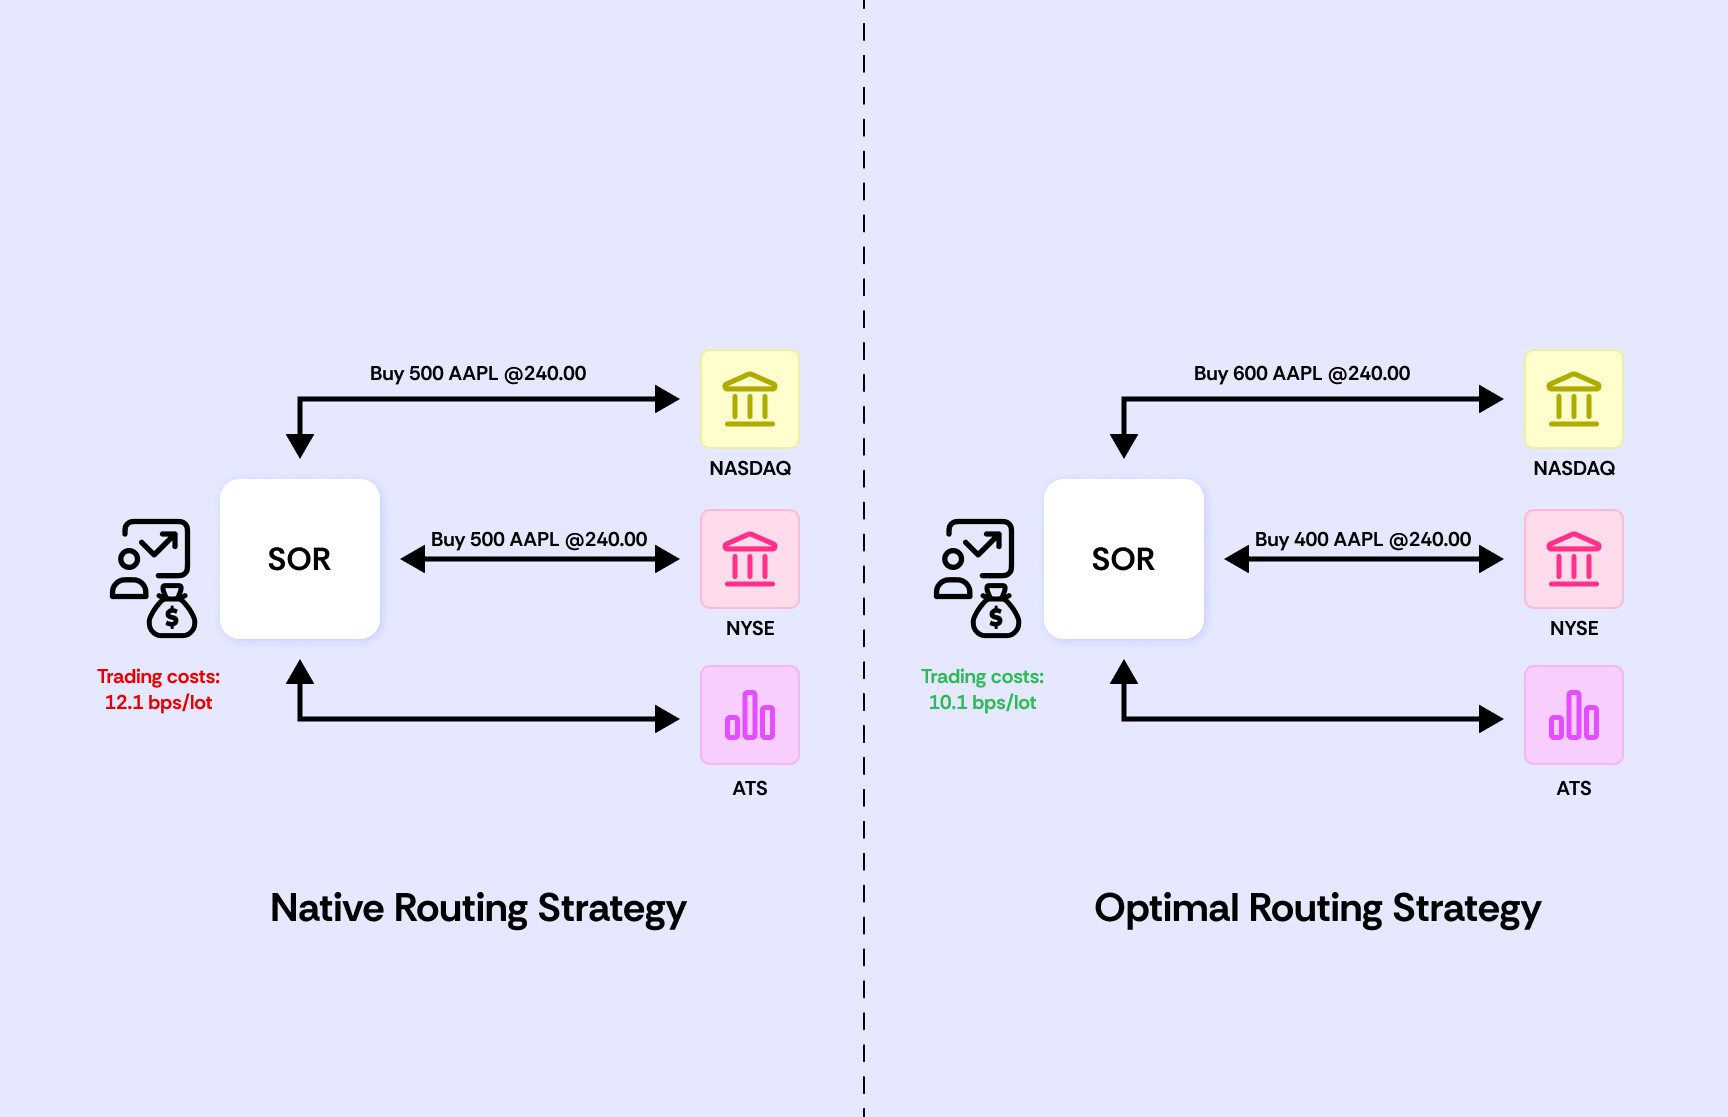
The equal-split strategy gives traders confidence that they're participating fairly across the market. By sending identical quantities to each venue, you know you're not overexposing yourself to any single exchange's risks. More nuanced approaches can route based on known liquidity pools for a specific asset, where historical data shows the best prices/lowest market impact. This might result in 600/400 split, for example.
However, this simplicity masks significant realities. Queue dynamics shift rapidly across venues, leaving equal-split orders stuck in long queues at some exchanges while shorter queues exist elsewhere. Traditional router's predictable patterns make them vulnerable to sophisticated players who can anticipate their behavior and pick them off. And while these routers might consider liquidity or order aggression, they often ignore crucial factors like exchange fees, rebates, and historical fill rates—creating unnecessary costs that compound over time.
A nearly dimensionless SOR just isn’t powerful enough to model the complexities of today’s market, and if you’re using one, you’re leaving money on the table.
Beyond Simple Optimization: A Truly Adaptive Router
An ‘optimized’ SOR aims to solve this problem. Rather than naively splitting orders, an optimized router considers multiple dimensions that map much closer to real market dynamics.
Consider how an optimized router might handle that same 1000-share AAPL order. Instead of a simple 50/50 split, it examines the current state of each venue. It sees that NYSE has a queue of 5000 shares at the best bid, while NASDAQ's queue is only 1000 shares deep. It knows from analyzing order flow patterns that NASDAQ typically sees 2000 shares of outflow at this time of day, while NYSE sees 1500. The router factors in that NYSE offers a similar rebate per share for limit orders, but has recently had a much smaller market impact coefficient. It could even consider the opportunity cost of missing the scheduled target quantity value. All of these dimensions are mathematically expressed to the router, which can then infer which split combination results in the lowest cost.
But how much cost difference is there?
We ran a simulation showing results from our AAPL example. This particular optimized router is stochastic in nature, so we ran the simulation 100 times and computed the average cost you would pay over the mid-price. For venues with relatively low queue sizes compared to the outflow, the optimized router determines limit orders are primarily the best, since it receives rebates and has a high fill-probability. Indeed we see the limit order strategy far outperforming the market order strategy, but this isn’t always the case.

Figure 1: Average of n=100 simulations of the cost over mid-price. Limit orders were split evenly over both venues for all strategies shown in blue. Both venues had low queue sizes compared to their outflows. The optimal router calculated a 190 market / 689 limit - venue 1 / 679 limit - venue 2 split, where the over-placement behavior is learned when the penalty for unexecuted limit orders is high.
The optimized router will switch its strategy in a high queue / high opportunity cost environment. When fill probabilities are low, and the cost of falling behind schedule is high, the optimized router instead prefers market orders, since they have essentially 0 risk of not executing. Not only does the optimized router perform better in both situations, but a naive router that does well in one almost certainly performs much worse in the other. Here the cost increase is 4.39% in the best case scenario (Optimal vs 70-30 Split in Figure 2) and a 128.6% increase at worst!
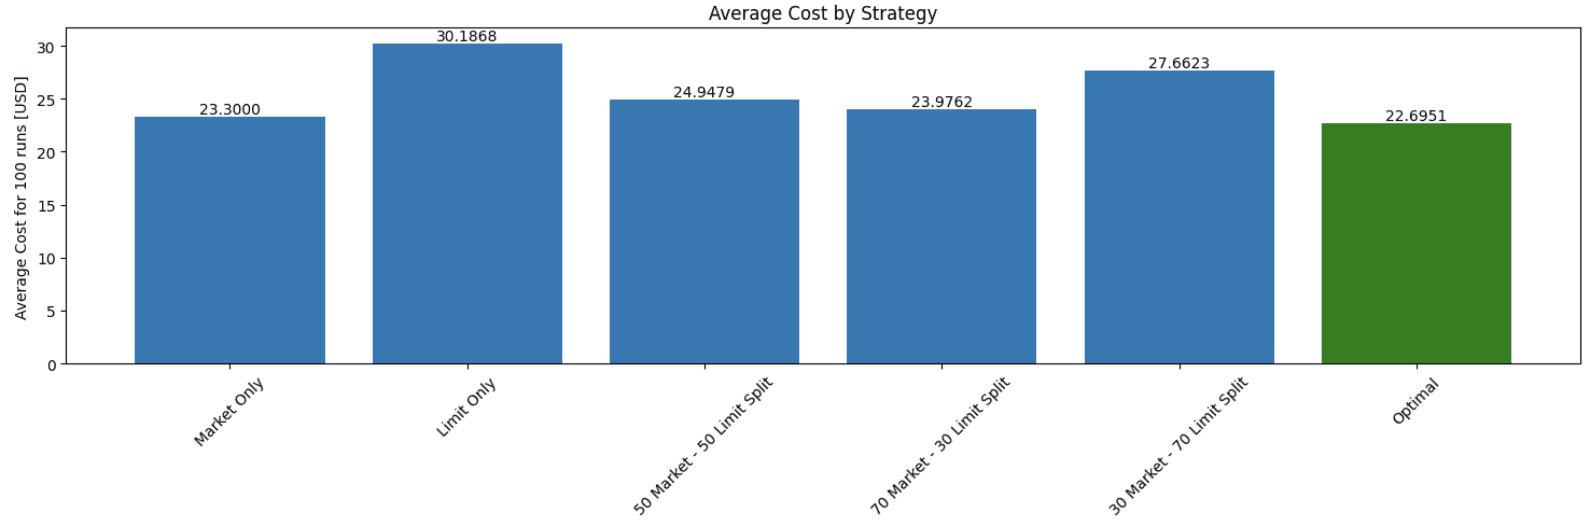
Figure 2. Average of n=100 simulations of the cost over mid-price. Limit orders were split evenly over both venues for all strategies shown in blue. Both venues had high queue sizes compared to their outflows. The optimal router calculated a 902 market / 82 limit - venue 1 / 83 limit - venue 2 split.
Beyond Routing: Optimizing Scheduling for Market Adaptation
But this optimization is not only limited to order routing algorithms—it also applies to order scheduling algorithms. Scheduling algorithms determine how child orders are broken down, when they are sent, and how they adapt in real time. Many trading desks rely on vanilla scheduling algorithms like TWAP, VWAP, and POV because they are simple and interpretable.
However, static execution schedules leave you vulnerable to market shifts. Consider the following real-world scenario to illustrate how static scheduling algorithms can erode your expected alpha.
Trade Setup
A hedge fund planned to purchase 50,000 shares of Tesla (TSLA). On the day before the company’s earnings call (January 27th, 2025), TSLA was trading around $393, with an average daily volume (ADV) on the order of tens of millions of shares (far more liquid than a typical mid-cap, but still subject to intraday liquidity swings).
Rationale: The fund’s quantitative models indicated that TSLA would outperform by about 2% over a short time horizon, making a rapid and efficient purchase critical to capturing alpha.
Expected Alpha
2% Outperformance Target: The fund’s internal models suggested a near-term price increase relative to the broader market, driven by positive sentiment and anticipated earnings surprises.
Execution Plan
Standard VWAP Strategy: The fund opted for a Volume-Weighted Average Price (VWAP) execution throughout the trading day. This is a common approach intended to “blend in” with average trading volumes.
Potential Issue: The VWAP strategy did not dynamically adjust for real-time volatility or the intraday spread spikes. As a result, the execution algorithm continued to feed orders even when the bid-ask spread widened sharply.

Outcome Under the Observed Spread Fluctuations
Intraday Spread Volatility:
• The provided chart shows that, on the day before earnings, TSLA’s bid-ask spread (in basis points) varied significantly—ranging roughly from 0.2 bps to over 2 bps at certain moments.
• Although TSLA is generally liquid, these sudden spikes in the spread can translate into meaningful increases in execution costs for large orders (like 50,000 shares) if the trades happen to cross the market at the wrong times.
Wider Effective Spread & Market Impact:
• As the VWAP algorithm worked through the day, periods of wider spreads forced the fund to pay more per share than initially anticipated.
• Because the purchase was sizeable (though not massive relative to TSLA’s ADV), repeated crossing of the spread at unfavorable times pushed the average fill price higher and ate into the expected alpha.
Alpha Slippage Due to Partial Fills:
• Intraday volatility and spread spikes led to delayed fills; some of the order was filled when liquidity was thinner, further driving up the fill price.
• As time passed and the market digested the presence of a large buyer, the price drifted upward. This drift is effectively the “market impact” cost.
Cross-Asset Effects (TSLA Options):
• Tesla’s options market is extremely active, especially around earnings. As the stock’s intraday volatility picked up, implied volatility on TSLA options also increased.
• If the fund or its prime broker attempted to hedge exposure with TSLA options, these higher implied vol levels would raise hedge costs, adding another layer of expense.
How to Transition to Smarter Execution Strategies
The evidence is clear: optimized routing strategies significantly outperform naive approaches. But how do you begin transitioning away from legacy routing systems? Try focusing on three key areas.
Measure Execution Efficiency with TCA
Run a detailed transaction cost analysis (TCA) focusing on routing and scheduling decisions. Identify patterns in execution data:
Are certain venues consistently underperforming?
Are you overpaying in exchange fees?
Are your orders getting picked off due to predictable behavior?
A/B Test Optimized Approaches in Real Markets
Instead of fully switching, test an optimized router alongside your current model. Ensure you account for adversarial responses and real-time market structure shifts, rather than relying solely on historical simulations.
Build or Partner?
Developing an in-house execution model requires quant researchers, engineers, and data infrastructure. While some firms invest in proprietary execution tech, partnering with an advanced provider can accelerate access to best-in-class optimization strategies.
The cost of inaction is clear. Every day you continue using a naive execution approach, you're paying unnecessary costs that compound over time. Whether you build or buy, the time to optimize your execution is now.
Are Your Execution Algorithms Keeping Up? The Hidden Cost of Legacy Routing Strategies
Many trading desks still rely on execution algorithms designed for a simple market structure—built for convenient liquidity conditions and slower-moving order flow. But in today’s fragmented, high-speed markets, these outdated strategies are quietly bleeding money. If your execution model isn’t adapting to real market conditions, how do you ensure you’re not consistently losing on price, fill quality, and execution efficiency?
Let’s consider the smart order router (SOR) algorithm. Traditional ‘naive’ SORs manage order flow across multiple venues using simple, intuitive rules. The most common approach divides orders evenly across exchanges, while slightly more sophisticated versions might adjust based on known liquidity pools or order type. Consider an example of buying 1000 AAPL stock. A typical decision we might see places all aggressive orders, but splits the purchase to NYSE/NASDAQ, 500 limit orders to each.
The equal-split strategy gives traders confidence that they're participating fairly across the market. By sending identical quantities to each venue, you know you're not overexposing yourself to any single exchange's risks. More nuanced approaches can route based on known liquidity pools for a specific asset, where historical data shows the best prices/lowest market impact. This might result in 600/400 split, for example.
However, this simplicity masks significant realities. Queue dynamics shift rapidly across venues, leaving equal-split orders stuck in long queues at some exchanges while shorter queues exist elsewhere. Traditional router's predictable patterns make them vulnerable to sophisticated players who can anticipate their behavior and pick them off. And while these routers might consider liquidity or order aggression, they often ignore crucial factors like exchange fees, rebates, and historical fill rates—creating unnecessary costs that compound over time.
A nearly dimensionless SOR just isn’t powerful enough to model the complexities of today’s market, and if you’re using one, you’re leaving money on the table.
Beyond Simple Optimization: A Truly Adaptive Router
An ‘optimized’ SOR aims to solve this problem. Rather than naively splitting orders, an optimized router considers multiple dimensions that map much closer to real market dynamics.
Consider how an optimized router might handle that same 1000-share AAPL order. Instead of a simple 50/50 split, it examines the current state of each venue. It sees that NYSE has a queue of 5000 shares at the best bid, while NASDAQ's queue is only 1000 shares deep. It knows from analyzing order flow patterns that NASDAQ typically sees 2000 shares of outflow at this time of day, while NYSE sees 1500. The router factors in that NYSE offers a similar rebate per share for limit orders, but has recently had a much smaller market impact coefficient. It could even consider the opportunity cost of missing the scheduled target quantity value. All of these dimensions are mathematically expressed to the router, which can then infer which split combination results in the lowest cost.
But how much cost difference is there?
We ran a simulation showing results from our AAPL example. This particular optimized router is stochastic in nature, so we ran the simulation 100 times and computed the average cost you would pay over the mid-price. For venues with relatively low queue sizes compared to the outflow, the optimized router determines limit orders are primarily the best, since it receives rebates and has a high fill-probability. Indeed we see the limit order strategy far outperforming the market order strategy, but this isn’t always the case.
Figure 1: Average of n=100 simulations of the cost over mid-price. Limit orders were split evenly over both venues for all strategies shown in blue. Both venues had low queue sizes compared to their outflows. The optimal router calculated a 190 market / 689 limit - venue 1 / 679 limit - venue 2 split, where the over-placement behavior is learned when the penalty for unexecuted limit orders is high.
The optimized router will switch its strategy in a high queue / high opportunity cost environment. When fill probabilities are low, and the cost of falling behind schedule is high, the optimized router instead prefers market orders, since they have essentially 0 risk of not executing. Not only does the optimized router perform better in both situations, but a naive router that does well in one almost certainly performs much worse in the other. Here the cost increase is 4.39% in the best case scenario (Optimal vs 70-30 Split in Figure 2) and a 128.6% increase at worst!
Figure 2. Average of n=100 simulations of the cost over mid-price. Limit orders were split evenly over both venues for all strategies shown in blue. Both venues had high queue sizes compared to their outflows. The optimal router calculated a 902 market / 82 limit - venue 1 / 83 limit - venue 2 split.
Beyond Routing: Optimizing Scheduling for Market Adaptation
But this optimization is not only limited to order routing algorithms—it also applies to order scheduling algorithms. Scheduling algorithms determine how child orders are broken down, when they are sent, and how they adapt in real time. Many trading desks rely on vanilla scheduling algorithms like TWAP, VWAP, and POV because they are simple and interpretable.
However, static execution schedules leave you vulnerable to market shifts. Consider the following real-world scenario to illustrate how static scheduling algorithms can erode your expected alpha.
Trade Setup
A hedge fund planned to purchase 50,000 shares of Tesla (TSLA). On the day before the company’s earnings call (January 27th, 2025), TSLA was trading around $393, with an average daily volume (ADV) on the order of tens of millions of shares (far more liquid than a typical mid-cap, but still subject to intraday liquidity swings).
Rationale: The fund’s quantitative models indicated that TSLA would outperform by about 2% over a short time horizon, making a rapid and efficient purchase critical to capturing alpha.
Expected Alpha
2% Outperformance Target: The fund’s internal models suggested a near-term price increase relative to the broader market, driven by positive sentiment and anticipated earnings surprises.
Execution Plan
Standard VWAP Strategy: The fund opted for a Volume-Weighted Average Price (VWAP) execution throughout the trading day. This is a common approach intended to “blend in” with average trading volumes.
Potential Issue: The VWAP strategy did not dynamically adjust for real-time volatility or the intraday spread spikes. As a result, the execution algorithm continued to feed orders even when the bid-ask spread widened sharply.
Outcome Under the Observed Spread Fluctuations
Intraday Spread Volatility:
• The provided chart shows that, on the day before earnings, TSLA’s bid-ask spread (in basis points) varied significantly—ranging roughly from 0.2 bps to over 2 bps at certain moments.
• Although TSLA is generally liquid, these sudden spikes in the spread can translate into meaningful increases in execution costs for large orders (like 50,000 shares) if the trades happen to cross the market at the wrong times.
Wider Effective Spread & Market Impact:
• As the VWAP algorithm worked through the day, periods of wider spreads forced the fund to pay more per share than initially anticipated.
• Because the purchase was sizeable (though not massive relative to TSLA’s ADV), repeated crossing of the spread at unfavorable times pushed the average fill price higher and ate into the expected alpha.
Alpha Slippage Due to Partial Fills:
• Intraday volatility and spread spikes led to delayed fills; some of the order was filled when liquidity was thinner, further driving up the fill price.
• As time passed and the market digested the presence of a large buyer, the price drifted upward. This drift is effectively the “market impact” cost.
Cross-Asset Effects (TSLA Options):
• Tesla’s options market is extremely active, especially around earnings. As the stock’s intraday volatility picked up, implied volatility on TSLA options also increased.
• If the fund or its prime broker attempted to hedge exposure with TSLA options, these higher implied vol levels would raise hedge costs, adding another layer of expense.
How to Transition to Smarter Execution Strategies
The evidence is clear: optimized routing strategies significantly outperform naive approaches. But how do you begin transitioning away from legacy routing systems? Try focusing on three key areas.
Measure Execution Efficiency with TCA
Run a detailed transaction cost analysis (TCA) focusing on routing and scheduling decisions. Identify patterns in execution data:
Are certain venues consistently underperforming?
Are you overpaying in exchange fees?
Are your orders getting picked off due to predictable behavior?
A/B Test Optimized Approaches in Real Markets
Instead of fully switching, test an optimized router alongside your current model. Ensure you account for adversarial responses and real-time market structure shifts, rather than relying solely on historical simulations.
Build or Partner?
Developing an in-house execution model requires quant researchers, engineers, and data infrastructure. While some firms invest in proprietary execution tech, partnering with an advanced provider can accelerate access to best-in-class optimization strategies.
The cost of inaction is clear. Every day you continue using a naive execution approach, you're paying unnecessary costs that compound over time. Whether you build or buy, the time to optimize your execution is now.