Edited by Pranav Udeshi
Mar 4, 2025
The Hidden Costs of Optimizing Around the Wrong Metrics in TCA

Introduction: The Cost of Every Trade
In the realm of trading, every transaction carries inherent costs that, while often overlooked, can significantly impact overall profitability. These costs are not limited to explicit fees like commissions but extend to implicit costs such as market impact, slippage, and opportunity costs. For instance, studies have found that average transaction costs for NYSE stocks are approximately 8.8 basis points (bps), while NASDAQ stocks experience higher costs around 13.8 bps. Additionally, the bid-ask spread—a key component of slippage—varies with company size; large-cap stocks typically have narrower spreads averaging 9.1 bps, whereas small-cap stocks face wider spreads averaging 84.3 bps. Over time, even minor inefficiencies in execution can accumulate, leading to millions in avoidable trading costs every year. Recognizing and accurately measuring these hidden costs is essential for traders aiming to optimize their strategies and enhance performance.
“For every dollar you earn trading, how much are you leaving on the table due to hidden costs?”
Traditional metrics, such as simple markouts or spreads, often provide an incomplete picture of trading efficiency. While they may highlight immediate slippage, they frequently overlook broader factors like liquidity constraints, price movements, and adverse selection. To truly understand and mitigate the costs associated with trading, a more comprehensive approach is necessary—one that delves deeper into the nuances of execution and market dynamics.
Traditional Metric: The Inadequacy of Markouts and Slippage
What are Slippage and Markouts?
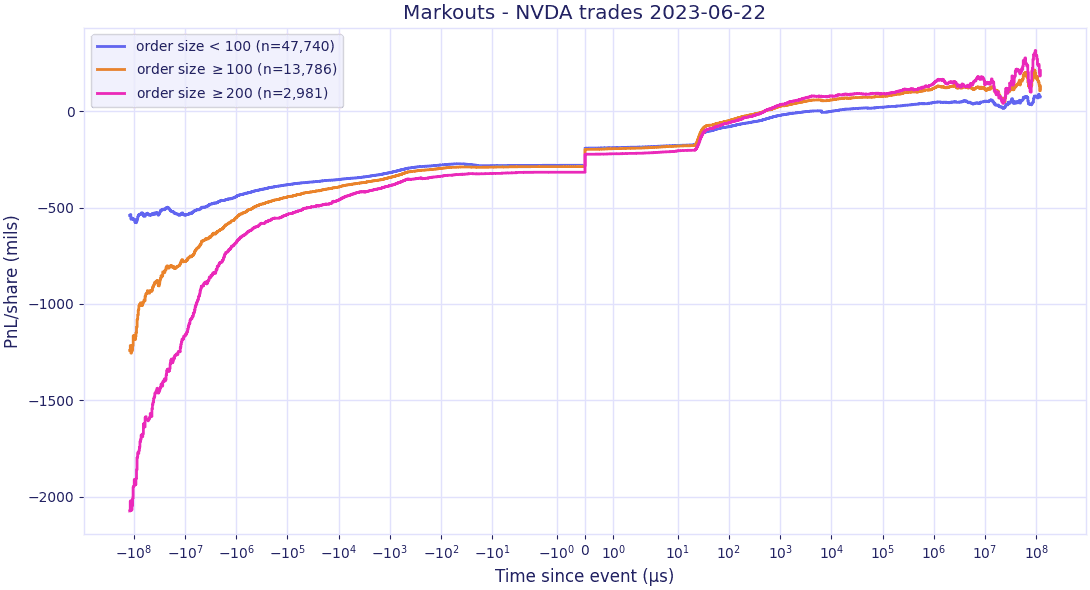
Markouts and slippage are both commonly used measures of trading PnL. A markout refers to the difference between the execution price of a trade and the midpoint price at the time of order placement, essentially assessing how favorably or unfavorably a trade was executed relative to the market price or a benchmark (like TWAP, or VWAP). In contrast, slippage measures the difference between the “arrival price” of the trade, and actual execution price. In essence, while markouts evaluate execution quality based on post-trade market conditions, slippage focuses on the cost incurred due to delays and market impact from the moment the order is received. Both measures are based on comparing the execution price versus a static benchmark pre or post trade.

The above figure demonstrates the difference between measurements of slippage (left), and markouts (right). Slippage is measured from the time of order submission to execution, and markouts measure the difference in price beteween the execution and some price after the trade (i.e. market mid quote 10s later).
Why Measuring Slippage and Markouts Don’t Lead to Good Outcomes:
Unfortunately, while order slippage and markouts provide a concrete objective function for traders by quantifying the cost relative to a benchmark, these metrics do not offer directional guidance on improving overall profitability. For instance, knowing the slippage does not answer the basic question of whether the trader should have executed the order more quickly or more slowly.
Measuring slippage alone does not reveal the underlying drivers of price movement during execution; it simply quantifies the cost without explaining whether the adverse move was due to liquidity constraints, market impact, or external volatility.
While markouts capture the difference between the execution price and a post-trade benchmark, they similarly lack explanatory power regarding the optimal execution speed or strategy.
Both slippage and markouts offer a retrospective view that fails to capture the context of the trade—such as the trader's intent, prevailing market conditions, or the specific strategy employed—leaving the trader without actionable intelligence on how to adjust their trading process to reduce costs and improve P&L.
Advanced Metrics Beyond Simple Markouts
Classic transaction cost analysis (TCA) typically compares fill prices to a reference midpoint at order entry. However, advanced TCA leverages statistical models to quantitatively assess execution performance—enabling traders to determine precisely how to adjust strategies under varying market conditions. The following model-based TCA metrics provide deeper insights into execution quality:
Price Impact Modeling
Definition: Price impact quantifies the adverse price movement directly caused by your trading activity. When you trade aggressively—executing large orders in short time frames—the market price may move against you, thereby increasing execution costs. Models such as Almgren-Chriss, Obizhaeva-Wang, and the Alfonsi-Fruth-Schied framework help quantify both temporary and permanent components of price impact.
Utility: Measuring price impact enables the calibration of order-slicing strategies, balancing execution speed against adverse price movement to optimize overall cost.
Alpha Slippage
Definition: Alpha slippage represents the portion of order slippage attributable to market drift—the natural price movement that occurs regardless of your trading activity. Unlike direct price impact, which is induced by your own actions, alpha slippage erodes your expected excess returns ("alpha") because the market naturally moves away from your arrival price.
Utility: By employing short-term forecasting models (ranging from ARIMA to advanced machine learning algorithms), traders can better predict intraday trends and identify optimal execution times, thus preserving more of the expected alpha. Often, institutions with less robust predictive capabilities choose to outsource execution to minimize this risk.
Cross-Asset Order Flow Imbalance
Definition: This metric measures the spillover effects when trading in one asset influences the price dynamics of correlated assets—such as those in the same sector or driven by common factors.
Utility: Monitoring cross-asset imbalances is particularly valuable in multi-leg trades. For instance, in a rates relative value trade (e.g., cash curve or basis trade), aggressive execution on one leg can inadvertently widen spreads in related instruments. Recognizing these interactions allows for more synchronized order routing and execution.
Implications for Trading Strategy
Integrating these advanced TCA metrics into your decision-making framework provides clear guidance on optimizing execution:
Trading Speed Decisions:
When alpha slippage dominates—meaning market drift is eroding your expected returns regardless of how fast you trade—the optimal strategy is to accelerate execution. Faster trading can capture more of your anticipated alpha before market conditions deteriorate. Conversely, if price impact is the primary cost driver, a slower, more deliberate execution can help mitigate adverse price movements.
Order Placement and Routing Decisions:
Effective execution requires more than just timing trades; it also involves choosing the right venues. By evaluating real-time liquidity and flow quality across different trading venues, you can opportunistically capture liquidity while dynamically adjusting your allocation. This responsive approach ensures that order routing decisions are made with a full understanding of both market impact and cross-asset effects.
The Risks of Optimizing Around the Wrong Metrics
Relying solely on traditional metrics like slippage can lead to inefficient and misguided TCA optimization. For example, consider comparing two trading algorithms—Algorithm A, which handles large parent orders averaging $300M, and Algorithm B, which processes medium-sized orders for cash treasuries between $200M and $300M.

You observe that Algo A has an average slippage of 15.0 bps per trade, while Algo B’s slippage is only 10.0 bps. Notably, Algo B’s child orders are, on average, 30% smaller than those of Algo A. Based on these numbers, you might conclude that reducing the size of Algo A’s child orders should lower its slippage. However, when you reduce Algo A’s order size by 30%, you find that although the average slippage per order decreases, the overall cumulative slippage remains higher. The reason is that the extended execution horizon exposes the trade to additional price swings, ultimately driving up the total cost. Conversely, if you instead increase Algo A’s average order size by 15%, the slippage increases because the enhanced price impact of each larger order outweighs the benefits of a shorter execution window.
Without a robust model to describe these tradeoffs, determining optimal sizing and timing becomes a costly process of guesswork and repeated experimentation—often illustrated by analyzing slippage across different time horizons as in the example below.
Instead, partnering with a TCA provider who can dynamically identify the ideal trade-slicing strategy offers a more effective solution. By calibrating a price impact model based on historical execution data and estimating market drift through proprietary short-term alpha forecasting, traders can make informed adjustments. In our example, advanced modeling revealed that, for most days, Algo A performs best when the average order size is increased by 10%. Unlike a naive approach based solely on slippage averages, this comprehensive TCA analysis provides actionable recommendations with the necessary context to optimize overall PnL.
Why a Dynamic, Holistic TCA Framework Matters & Next Steps
A robust Transaction Cost Analysis (TCA) framework must be both dynamic and holistic—adapting in real time while integrating multiple metrics—to capture the full spectrum of execution costs and drive superior trading outcomes. Traditional metrics like simple markouts provide only a snapshot of execution quality, often missing critical elements such as market impact, cross-asset interactions, and alpha slippage. By contrast, a dynamic TCA framework continuously monitors key indicators (e.g., partial fills, slippage, volatility shifts) and employs adaptive order-slicing models (such as Almgren-Chriss) to optimize trade execution in real time. Simultaneously, a holistic approach combines multiple metrics—like Implementation Shortfall, VWAP deviation, price impact estimates, and cross-asset correlations—with contextual analysis of liquidity, market microstructure, and macroeconomic events. This multi-metric, aggregated evaluation enables traders to detect recurring inefficiencies and recalibrate their strategies promptly, ensuring that hidden costs are mitigated and alpha is preserved.
To support you in elevating your TCA framework, we offer specialized resources:
Exclusive Whitepaper: Gain in-depth insights into advanced TCA methodologies and actionable strategies.
Personalized Consultation: Work with our experts to assess and enhance your current framework, ensuring it meets the demands of today’s dynamic markets.
Don't leave execution costs to chance—take the next step to transform your trading outcomes by adopting a dynamic, holistic TCA framework. Contact us today to access our whitepaper or schedule a consultation and start optimizing your execution strategy for maximum profitability.
Introduction: The Cost of Every Trade
In the realm of trading, every transaction carries inherent costs that, while often overlooked, can significantly impact overall profitability. These costs are not limited to explicit fees like commissions but extend to implicit costs such as market impact, slippage, and opportunity costs. For instance, studies have found that average transaction costs for NYSE stocks are approximately 8.8 basis points (bps), while NASDAQ stocks experience higher costs around 13.8 bps. Additionally, the bid-ask spread—a key component of slippage—varies with company size; large-cap stocks typically have narrower spreads averaging 9.1 bps, whereas small-cap stocks face wider spreads averaging 84.3 bps. Over time, even minor inefficiencies in execution can accumulate, leading to millions in avoidable trading costs every year. Recognizing and accurately measuring these hidden costs is essential for traders aiming to optimize their strategies and enhance performance.
“For every dollar you earn trading, how much are you leaving on the table due to hidden costs?”
Traditional metrics, such as simple markouts or spreads, often provide an incomplete picture of trading efficiency. While they may highlight immediate slippage, they frequently overlook broader factors like liquidity constraints, price movements, and adverse selection. To truly understand and mitigate the costs associated with trading, a more comprehensive approach is necessary—one that delves deeper into the nuances of execution and market dynamics.
Traditional Metric: The Inadequacy of Markouts and Slippage
What are Slippage and Markouts?
Markouts and slippage are both commonly used measures of trading PnL. A markout refers to the difference between the execution price of a trade and the midpoint price at the time of order placement, essentially assessing how favorably or unfavorably a trade was executed relative to the market price or a benchmark (like TWAP, or VWAP). In contrast, slippage measures the difference between the “arrival price” of the trade, and actual execution price. In essence, while markouts evaluate execution quality based on post-trade market conditions, slippage focuses on the cost incurred due to delays and market impact from the moment the order is received. Both measures are based on comparing the execution price versus a static benchmark pre or post trade.
The above figure demonstrates the difference between measurements of slippage (left), and markouts (right). Slippage is measured from the time of order submission to execution, and markouts measure the difference in price beteween the execution and some price after the trade (i.e. market mid quote 10s later).
Why Measuring Slippage and Markouts Don’t Lead to Good Outcomes:
Unfortunately, while order slippage and markouts provide a concrete objective function for traders by quantifying the cost relative to a benchmark, these metrics do not offer directional guidance on improving overall profitability. For instance, knowing the slippage does not answer the basic question of whether the trader should have executed the order more quickly or more slowly.
Measuring slippage alone does not reveal the underlying drivers of price movement during execution; it simply quantifies the cost without explaining whether the adverse move was due to liquidity constraints, market impact, or external volatility.
While markouts capture the difference between the execution price and a post-trade benchmark, they similarly lack explanatory power regarding the optimal execution speed or strategy.
Both slippage and markouts offer a retrospective view that fails to capture the context of the trade—such as the trader's intent, prevailing market conditions, or the specific strategy employed—leaving the trader without actionable intelligence on how to adjust their trading process to reduce costs and improve P&L.
Advanced Metrics Beyond Simple Markouts
Classic transaction cost analysis (TCA) typically compares fill prices to a reference midpoint at order entry. However, advanced TCA leverages statistical models to quantitatively assess execution performance—enabling traders to determine precisely how to adjust strategies under varying market conditions. The following model-based TCA metrics provide deeper insights into execution quality:
Price Impact Modeling
Definition: Price impact quantifies the adverse price movement directly caused by your trading activity. When you trade aggressively—executing large orders in short time frames—the market price may move against you, thereby increasing execution costs. Models such as Almgren-Chriss, Obizhaeva-Wang, and the Alfonsi-Fruth-Schied framework help quantify both temporary and permanent components of price impact.
Utility: Measuring price impact enables the calibration of order-slicing strategies, balancing execution speed against adverse price movement to optimize overall cost.
Alpha Slippage
Definition: Alpha slippage represents the portion of order slippage attributable to market drift—the natural price movement that occurs regardless of your trading activity. Unlike direct price impact, which is induced by your own actions, alpha slippage erodes your expected excess returns ("alpha") because the market naturally moves away from your arrival price.
Utility: By employing short-term forecasting models (ranging from ARIMA to advanced machine learning algorithms), traders can better predict intraday trends and identify optimal execution times, thus preserving more of the expected alpha. Often, institutions with less robust predictive capabilities choose to outsource execution to minimize this risk.
Cross-Asset Order Flow Imbalance
Definition: This metric measures the spillover effects when trading in one asset influences the price dynamics of correlated assets—such as those in the same sector or driven by common factors.
Utility: Monitoring cross-asset imbalances is particularly valuable in multi-leg trades. For instance, in a rates relative value trade (e.g., cash curve or basis trade), aggressive execution on one leg can inadvertently widen spreads in related instruments. Recognizing these interactions allows for more synchronized order routing and execution.
Implications for Trading Strategy
Integrating these advanced TCA metrics into your decision-making framework provides clear guidance on optimizing execution:
Trading Speed Decisions:
When alpha slippage dominates—meaning market drift is eroding your expected returns regardless of how fast you trade—the optimal strategy is to accelerate execution. Faster trading can capture more of your anticipated alpha before market conditions deteriorate. Conversely, if price impact is the primary cost driver, a slower, more deliberate execution can help mitigate adverse price movements.
Order Placement and Routing Decisions:
Effective execution requires more than just timing trades; it also involves choosing the right venues. By evaluating real-time liquidity and flow quality across different trading venues, you can opportunistically capture liquidity while dynamically adjusting your allocation. This responsive approach ensures that order routing decisions are made with a full understanding of both market impact and cross-asset effects.
The Risks of Optimizing Around the Wrong Metrics
Relying solely on traditional metrics like slippage can lead to inefficient and misguided TCA optimization. For example, consider comparing two trading algorithms—Algorithm A, which handles large parent orders averaging $300M, and Algorithm B, which processes medium-sized orders for cash treasuries between $200M and $300M.
You observe that Algo A has an average slippage of 15.0 bps per trade, while Algo B’s slippage is only 10.0 bps. Notably, Algo B’s child orders are, on average, 30% smaller than those of Algo A. Based on these numbers, you might conclude that reducing the size of Algo A’s child orders should lower its slippage. However, when you reduce Algo A’s order size by 30%, you find that although the average slippage per order decreases, the overall cumulative slippage remains higher. The reason is that the extended execution horizon exposes the trade to additional price swings, ultimately driving up the total cost. Conversely, if you instead increase Algo A’s average order size by 15%, the slippage increases because the enhanced price impact of each larger order outweighs the benefits of a shorter execution window.
Without a robust model to describe these tradeoffs, determining optimal sizing and timing becomes a costly process of guesswork and repeated experimentation—often illustrated by analyzing slippage across different time horizons as in the example below.
Instead, partnering with a TCA provider who can dynamically identify the ideal trade-slicing strategy offers a more effective solution. By calibrating a price impact model based on historical execution data and estimating market drift through proprietary short-term alpha forecasting, traders can make informed adjustments. In our example, advanced modeling revealed that, for most days, Algo A performs best when the average order size is increased by 10%. Unlike a naive approach based solely on slippage averages, this comprehensive TCA analysis provides actionable recommendations with the necessary context to optimize overall PnL.
Why a Dynamic, Holistic TCA Framework Matters & Next Steps
A robust Transaction Cost Analysis (TCA) framework must be both dynamic and holistic—adapting in real time while integrating multiple metrics—to capture the full spectrum of execution costs and drive superior trading outcomes. Traditional metrics like simple markouts provide only a snapshot of execution quality, often missing critical elements such as market impact, cross-asset interactions, and alpha slippage. By contrast, a dynamic TCA framework continuously monitors key indicators (e.g., partial fills, slippage, volatility shifts) and employs adaptive order-slicing models (such as Almgren-Chriss) to optimize trade execution in real time. Simultaneously, a holistic approach combines multiple metrics—like Implementation Shortfall, VWAP deviation, price impact estimates, and cross-asset correlations—with contextual analysis of liquidity, market microstructure, and macroeconomic events. This multi-metric, aggregated evaluation enables traders to detect recurring inefficiencies and recalibrate their strategies promptly, ensuring that hidden costs are mitigated and alpha is preserved.
To support you in elevating your TCA framework, we offer specialized resources:
Exclusive Whitepaper: Gain in-depth insights into advanced TCA methodologies and actionable strategies.
Personalized Consultation: Work with our experts to assess and enhance your current framework, ensuring it meets the demands of today’s dynamic markets.
Don't leave execution costs to chance—take the next step to transform your trading outcomes by adopting a dynamic, holistic TCA framework. Contact us today to access our whitepaper or schedule a consultation and start optimizing your execution strategy for maximum profitability.